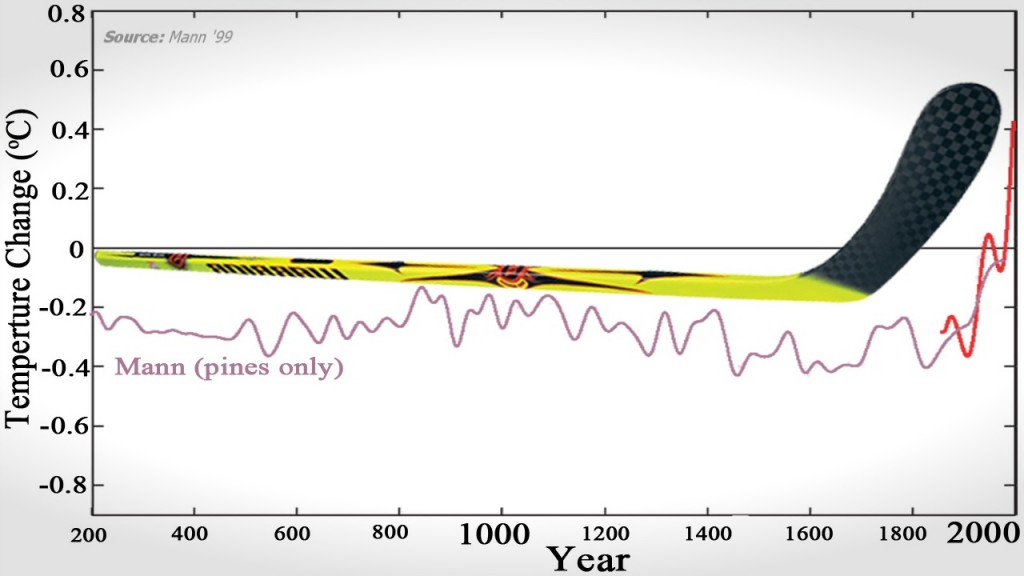
In a nutshell, why is the central argument proving man-made, Global Warming, the “Hockey Stick” graph, almost universally discredited?
The most emotive and pivotal evidence for catastrophic, Global Warming is the legendary, “Hockey Stick” graph. The evidence proving Global Warming has been thinner on the ground than many would believe considering the vehemence of those you promote it. However, with a dearth of other evidence available, the “Hockey Stick” was always there to wave in front of the masses. Without the hard Stick to do the convincing, do we still have CO2-based, Global Warming?
What is the “Hockey Stick”?
It shows a 1000 years or so of low stable temperatures and the last 100 of rapid increases. Famously in “An Inconvenient Truth” Al Gore uses it to great, dramatic effect and the IPCC (the body of scientists promoting Global Warming) have used it as the gold standard for their Warming message.
Most scientists, who have looked under the bonnet of the “Hockey Stick” (famously Steve McIntyre), have come to the opinion that it isn’t worth its weight in salt. Not only could you relatively easily deem the math behind it lazy, you could claim it farcical.
I thought the “Hockey Stick” saga was dead and gone, but recently commentors have cited and resuscitated it as sound, valid evidence for Global Warming. The attrition of the validity of “Hockey Stick” was a slow and painful process for those involved. But, I think that story has come to the end of its road. Scientists are usually pretty poor at stats, strange but true, but, in this story, the stats won the day. It is reasonable to say that the “Hockey Stick” hasn’t got a leg to stand on.
What’s wrong with the Hockey Stick (in just one sentence)?
The Hockey Stick has been pretty much universally discredited, even in the face of proponents, such as Amman and Wahl, that have tried to resuscitate it? How so?
Basically, after years of Hockey Stick criticism, Amman and Wahl in 2005 tried to publish a few papers defending it however within one of them they let the cat out of the bag…
“buried deep within the paper, Amman and Wahl had quietly revealed their verification r2 figures, which were, just as McIntyre had predicted, close to zero for most of the reconstruction, strongly suggesting that the hockey stick had little predictive power.”
“Caspar and the Jesus paper” (by “Bishop Hill”, an awesome blog where the convoluted becomes crystal clear)
This one sentence shows us that the statistics underlying the “Hockey Stick” were fudged and manipulated. As is normal scientific practice, Steve McIntyre (et al) badgered (err, requested) the authors of the Hockey Stick (esp. the progenitor Michael Mann) to disclose their methods. After 5 years of pursuit, Amman and Wahl quietly slipped the magic number out (the r2). They were probably, unwillingly forced to disclose this information as a prerequisite for their paper being published. Consequently, this magic number, the coefficient of determination (r2), was finally released. With a r2 close to “0”, this finally and unequivocally proved the “Hockey Stick” was no only baseless, but also decidedly misleading.
Anyway, it’s 40oC outside and boiling hot in here. I’m off to turn my rumbling air conditioner on full…


Very thorough research. I think you have presented this in a very coherent manner. If only more people would make such an effort.