CO2 is the flavour of the month (err, last 20 years), but, in many ways, it’s hard to justify it as the dominate force driving our climate. We just don’t have substantial evidence supporting it. No, seriously, this is an oft-ignored point, I still await a single bit of evidence to convince me there is anything behind the CO2 argument. Science, at the periphery of knowledge, is mostly shades of grey, and thankfully so, or it would be rather dull. However, is there “Global Warming” (implicitly defined as CO2 driven), well give me one chart of reliable data, I’ll consider it willingly and put the grey back into a black-and-white issue. Until we have this, can we explain, at least qualitatively, the alternative, major drivers that are leading to the current global warming?
Fortunately, the answer is “yes” and these forces, unlike CO2, do have substantial amounts of evidence supporting them.
What are the possible forces? Well, plants absorb CO2, ice reflects sunlight, greenhouse gases absorb sunlight and clouds both absorb and reflect sunlight… These all influence the Greenhouse effect, which is an important temperature input. But, are they primary drivers of Earth’s climate? What really feeds the system its energy? Well, it’s generally accepted as the sun and the sea. In particular, we could be really looking at the cycles of Sunspots, which are flares of intense magnetic activity, and the ocean currents. It is likely that global temperature is controlled by solar energy and then modulated by that phenomenal sump of energy that is the world’s oceans. The solar and oceanic cycles sometimes offset and sometimes complement each other. The many other influences, such as man-made CO2, are relatively minor and often offset each other.
The significance of sunspots and ocean currents in driving global temperatures has long been recognised and has stood the test of time. As far back as 1801, William Herschel noted an apparent connection between wheat prices and sunspot records. The evidence for both sunspots and ocean currents being the primary drivers of climate change is considerable, so why have we suddenly put the finger of “blame” on CO2? In addition, the current, gentle, warming they drive is far from catastrophic, it is beneficial.
The following video clip from the movie, “Church of Global Warming” shows the “sun and sea” hypothesis in action:
THE SUN (sunspots)
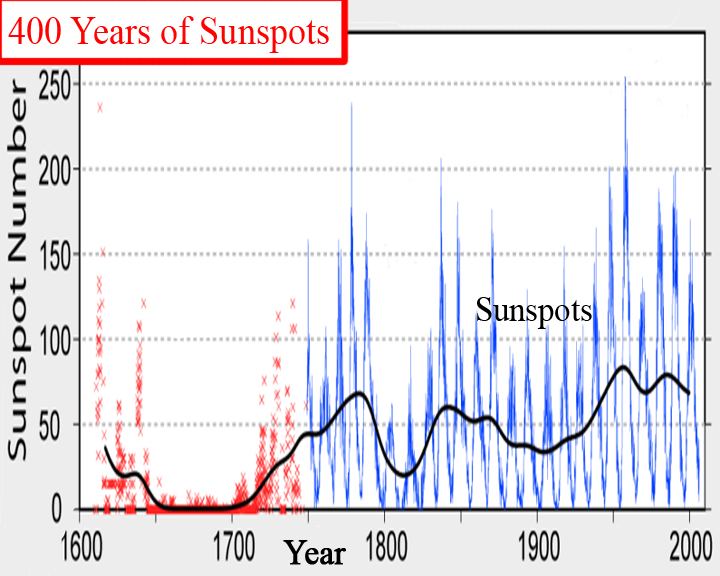
The sun’s Total Solar Irradiance (i.e. total energy output) does not vary, we believe, too significantly. Thus, how does the sun so noticeably influence Earth’s temperature? Well, if you concentrate instead on the intermittent spikes in intense magnetic activity, i.e. sunspots (or flares), then you have something to work with. Sunspot activity is highly variable and could reasonably account for the drastic modulations in Earth’s weather.
Global Warming has been happening for 400 years (not just during the last century of industrialisation as the IPCC quite controversially suggest with their famous Hockey Stick evidence – video here). In addition, it correlates well with sunspot levels, as seen by direct, observational data by astronomers. Since the Maunder Minimum (virtually no sunspots) of the 1600s, both sunspot number and global temperature have risen with a strong, significant correlation:
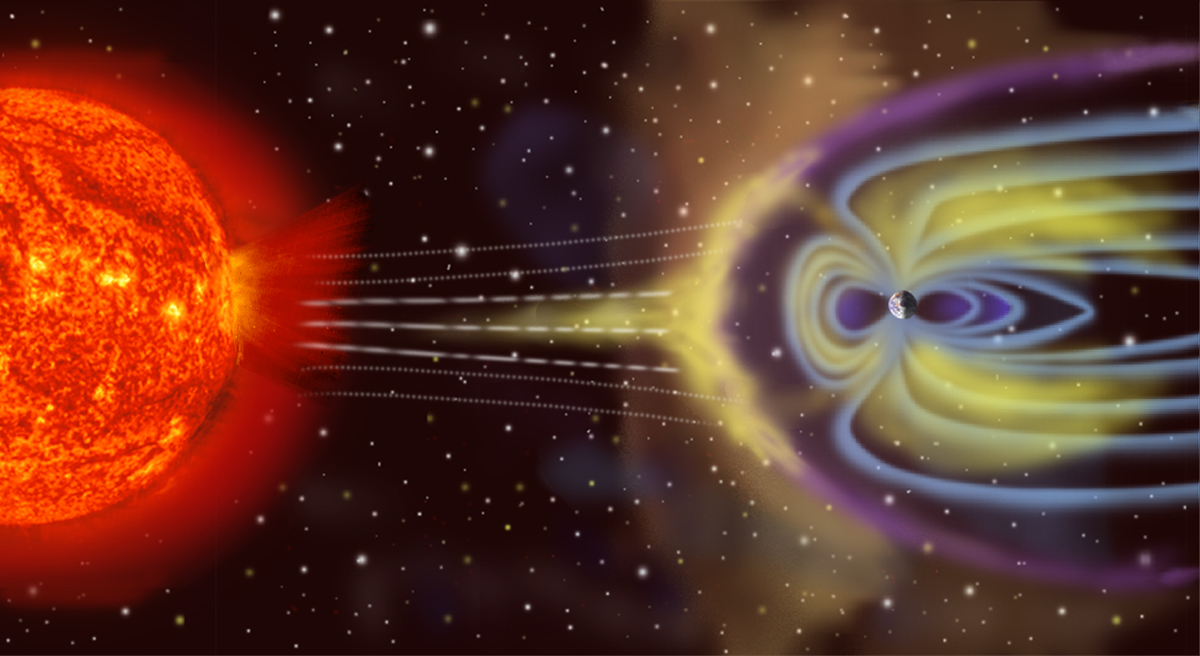
A sunspot in action – it’s affect on the Earth’s magnetic field (the Aurora Borealis is a frequently seen demonstration of its effects on our atmosphere’s chemistry):
THE SEA (ocean currents)
What are the “Pacific Decadal Oscillation” (PDO) and “El Niño / La Niña“? And why are they important in climate change?
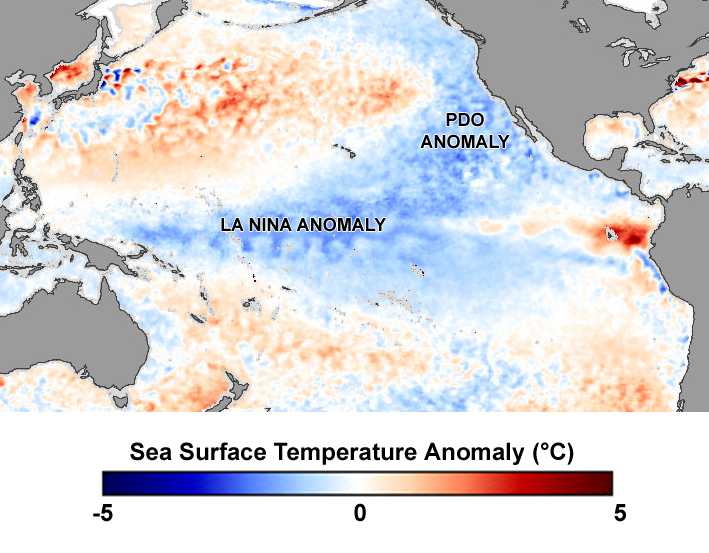
“El Nino / La Nina”, which are two sides of the same coin, and the “Pacific Decadal Oscillation” (PDO) are both ocean currents. They are both in the Pacific, the former being equatorial, the latter in the north. Both oscillate between warming and cooling phases of sea surface temperature (SST), which are above or below long-term averages. For “El Nino / La Nina”, El Nino is the negative, warming phase, La Nina is the positive, cooling phase. Conversely, for the PDO, a warming phase is called “positive” and the cooling as “negative”.
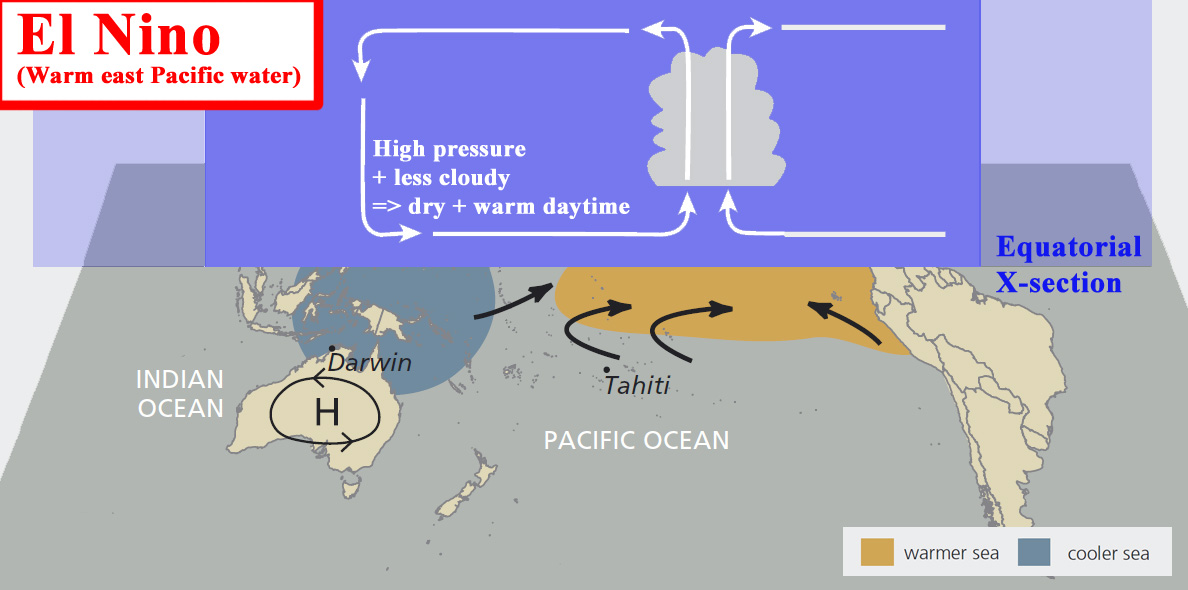
In particular, El Nino refers to the extensive warming of the central and eastern Pacific that leads to a major shift in weather patterns across the Pacific. This includes increased convection or cloudiness in the central tropical Pacific Ocean and weaker easterly, trade winds. In eastern Australia, however, these events are associated with an increased probability of drier conditions.
Adapted from: BOM
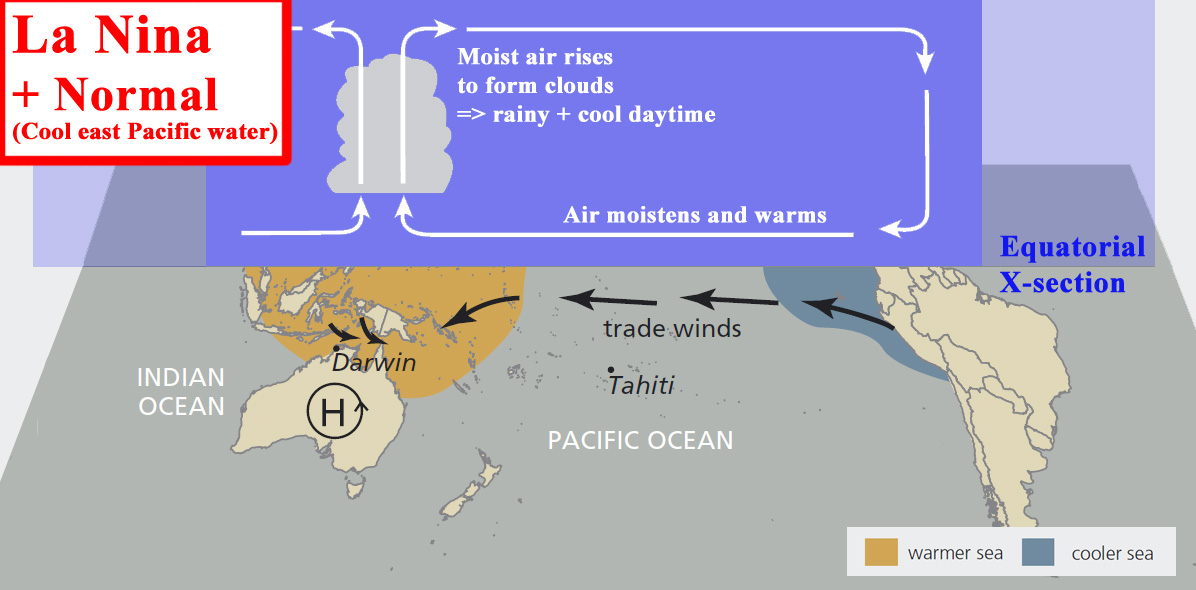
During, a neutral or La Nina event surface temperatures are cool in the east Pacific Ocean. Thus, Air travels to the low pressure in the west tropics (this process is known as the “trade winds”). En route, the air warms and moistens, which leads to clouds in Australia that increase local rainfall, but noticeably decreases daytime temperatures.Adapted from: BOM
During, an El Nino event surface temperatures are warm in the east Pacific Ocean. This halts the easterly trade winds. Pressure thus increases over Australia and less oceanic moisture is delivered there. This reduces cloud cover and thus rainfall, but can increase daytime temperatures.
For more on El Nino / La Nina check here.
This is Roy Spencer’s (recognised, satellite data, analysis guru) take on the PDO and El Nino:
“The Pacific Decadal Oscillation (PDO) is an internal switch between two slightly different circulation patterns that occurs every 30 years or so in the North Pacific Ocean. It was originally described in 1997 in the context of salmon production. It has a positive (warm) phase that tends to warm the land masses of the Northern Hemisphere, as well as a negative (cool) phase.
Like the El Nino and La Nina oscillation of the tropical Pacific (also called the El Nino – Southern Oscillation, or ENSO), the PDO represents two different average circulation states that the ocean-atmosphere system seems to have a difficult time choosing between. But whereas ENSO changes every few years, the PDO changes every thirty years or so. This long time scale makes the PDO a potential key player in climate change.”
Why does the ocean surface temperature matter?
Ocean surface temperatures influence the air temperature above them and evaporation rates. High temperatures lead to increased cloud cover, which can lead to warming or, bizarrely, cooling depending on the type of clouds formed and their altitude. Even the IPCC, who like to blame it all on CO2, acknowledge this:
“…cloud feedbacks remain the largest source of uncertainty…” (IPCC Report 2007)
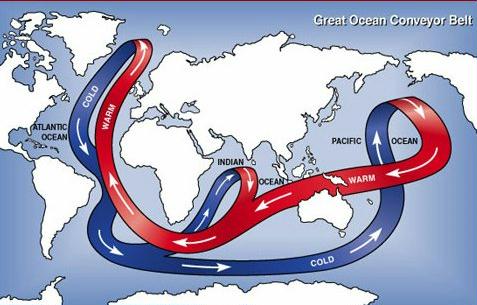
“Ocean Conyevour Belt”
This is a note of clarification. A lot is made of the PDO in the climate change debate and perhaps rightly so, however, this may be a debate bias because most of the oceanographic research comes out of the U.S. The PDO is a significant part of the “Ocean Conyevour Belt” (the global, continuous, ocean current circuit), but we should remember that it is still only one part of it:
CONCLUSION
The main drivers of global temperature are probably the sunspot levels and the ocean current temperatures. There are other short-term, temperature drivers (such as CO2), but Global Warming alarmists chose to gloss over the well-known, long standing evidence. The weight of this evidence indicates that it is the combination of the “sun and sea” that most likely drives global temperature.


“….if you concentrate instead on the intermittent spikes in intense magnetic activity, i.e. sunspots (or flares), then you have something to work with. Sunspot activity is highly variable and could reasonably account for the drastic modulations in Earth’s weather.”
This completely wrong. The spikes are not due to flares but faculae (which go along with sunspots) the dips are due to the darkening due to large spot groups. TSI instruments like ACRIM and SORCE have only ever registered a flare once and then it was barely distinguisbale from the noise.
Compared to the daily output of the Sun the total energy of a flare (radiation, kinetic, ionization, potential) of the biggest flare ever seen (which lasted for most of a day – which is unusual in and of itself) is 8 orders of magnitude smaller – that is a millionth of 1%. You are not going to get much warming from that – you need about a 1% upward trend in TSI over the last 50 years to explain GW. That just has not happened.
Many thanks, Dr. Keith Strong, for your take on the perhaps unsuitability of sunspots as a climate forcing.
Perhaps it’s worth plucking the words from the proverbial horses mouth. Professor Henrik Svensmark has been at the forefront of research into a possible, lab-verifiable (in this case CERN) mechanism whereby solar rays from sunspots could greatly influence temperature.
The idea that solar activity can mask cosmic rays which, in turn, prevents cloud condensation nuclei forming bright, low clouds largely belongs to his team. With fewer, low-level, bright clouds, there is decreased albedo of the suns rays and thus temperature increases. The net effect is that a small increase in the sun’s activity can have a significant increase in Earth’s temperature. Agreed, this is only a hypothesis. However, it does have tangible evidence backing it. This is perhaps more than can be said of the somewhat more controversial concept that we are in anthropogenic, CO2-lead, global warming?
Evidence for the correlation between sunspot activity, cosmic rays and cloud formation:
Words from “the horses mouth”…
Svensmark: “global warming stopped and a cooling is beginning” – “enjoy global warming while it lasts”
http://wattsupwiththat.com/2009/09/10/svensmark-global-warming-stopped-and-a-cooling-is-beginning-enjoy-global-warming-while-it-lasts/
“You may wonder why the international climate panel IPCC does not believe that the Sun’s changing activity affects the climate. The reason is that it considers only changes in solar radiation. That would be the simplest way for the Sun to change the climate – a bit like turning up and down the brightness of a light bulb.
Satellite measurements have shown that the variations of solar radiation are too small to explain climate change. But the panel has closed its eyes to another, much more powerful way for the Sun to affect Earth’s climate. In 1996 we discovered a surprising influence of the Sun – its impact on Earth’s cloud cover. High-energy accelerated particles coming from exploded stars, the cosmic rays, help to form clouds.
When the Sun is active, its magnetic field is better at shielding us against the cosmic rays coming from outer space, before they reach our planet. By regulating the Earth’s cloud cover, the Sun can turn the temperature up and down. High solar activity means fewer clouds and and a warmer world. Low solar activity and poorer shielding against cosmic rays result in increased cloud cover and hence a cooling. As the Sun’s magnetism doubled in strength during the 20th century, this natural mechanism may be responsible for a large part of global warming seen then.”
Cosmic ray are secondary feature of the variation of solar magnetic field, nit the primary source of the cooling of the Earth. Do not substitute the consequence with reason, please.
Cosmic rays intensity is always increased during the solar minima and reduced during solar maxima. There was no a significant increase of solar magnetic field in the past centuries as we have shown in our paper Zharkova et al, 2015, https://www.nature.com/articles/srep15689. But because Sun was shown to generate by dynamo machine two (and not a single) magnetic waves in the solar interior, which interfere with each other and produce the visible solar activity on the solar surface. This interference will lead to the modern grand solar minimum (GSM) approaching in 2020-2053 as shown in our paper above. This GSM is one of many others appeared in the past: Maunder Minimum, Wolf minimum, Oort minimum, Homeric minimum etc. which are detected by our observations and predicted by the Parker’s 2 layer dynamo model with meridional curculation.
But the increase of the solar irradiance and terrestrial temperature in the past 400 years was caused by the solar inertial motion, the orbital motion of all the planets of solar system, which overriden the solar activity effects.
Hence, the solar effect on the Earth and other planets comprises the sum of the solar activity of the Sun caused by solar dynamo effects and of the effect of inertial motion of the Sun imposed by the planets of the solar system. We have to respect our closest star and to learn to adopt to its condition and the Earth and planets did in the past millions of years.
The evidence has been around since 1896. http://www.rsc.org/images/Arrhenius1896_tcm18-173546.pdf
Actually, the global warming is mainly cause by the Sun itself. But not by its usual 11 year solar activity and increase or decrease of solar irradiance caused by it, in this point I would agree with the author of the article. However, the main role in global warming comes from the solar inertial motion as we have shown in the recent paper Zharkova et al, 2019, Nature Scientific Reports https://www.nature.com/articles/s41598-019-45584-3. This increase of solar irradiance started from the Maunder minimum in 17 century and will last for another 600 years until terrestrial temperature will increase from now by more than 2.5C. Then the reverse process of temperature decrease will start and last for another 2000 years when the temperature will return to the level of 17 century. On top of this orbital motion the effect of solar dynamo waves cause=ing the general solar activity will be over-imposed.
It looks like the authors of the article were not aware of much larger effect of the Sun on the Earth and other planets via its magnetic field. As it was shown in our first paper Zharkova et al, 2015 Scientific Reports, https://www.nature.com/articles/srep15689, the full disk solar magnetic field seen on the surface is a superposition of two magnetic waves. This superposition will lead to the modern grand solar minimum in 2020-2053, predicted by us in 2015. This overrides the global warming for these 33 years after which the Sun will return to normal solar activity for the next 370 years and global warming will be even higher than it is now until the Sun will approach the next grand solar minimum in 2370–2415. These two grand solar minima will give a bit of relief for the humankind to prepare for the maximum of solar irradiance in 2600-2700.
I do not object that green house gases can contribute with some extra-heating of the terrestrial atmosphere but they cannot compete with large star Sun moving towards the planets in the next 600 years. The Sun is the main source of heating of the Earth and other planets.